When I first started teaching forex to beginners, I realized something. Nobody cares about textbook definitions. They want to know: how do I actually start? What broker should I use? Will my money be safe on TradingView? And here's the biggest one — am I going to blow up my account on day one?
These are the real questions. So let me teach you exactly how we approach forex trading from day one at TFW Global. This isn't theory. This is what we teach in our beginner classes, week after week, to women who've never touched a chart in their lives.
What Is Forex Trading? A Simple Explanation
Forex is just trading currency pairs. EUR/USD means you're betting on whether the Euro will go up or down against the US Dollar. That's it. You're not buying a piece of a company. You're not betting on gold or oil. You're trading the value of one country's money against another's.
The beauty of forex is the leverage. With a small account, you can control a much larger position. This is also the danger. Leverage is how beginners blow up accounts. So we use a strict rule: never risk more than a tiny percentage of your account on any single trade.
What we teach: Before you open a real account with real money, you need to learn on demo. Demo means you're trading with fake money on your broker's platform. No risk. Just learning. This is non-negotiable.
Most people skip demo. They want to trade with real money immediately. Don't do this. I've watched hundreds of traders blow accounts because they didn't take demo seriously. Demo isn't a waste of time — it's insurance against losing real money.
"You guys should already have your demo broker account set up, so you could be using the paper trading option on TradingView. That's personally what I would do to get started. Once you're ready to fund a live account with real money, you will then decide what broker you actually want to use."
How Forex Trading Actually Works for Beginners
Let me walk you through the exact setup we recommend. You need three things: a TradingView account, a demo broker account, and our 21EMA system. That's it. You don't need fifteen indicators. You don't need to buy some expensive bot. You need simplicity.
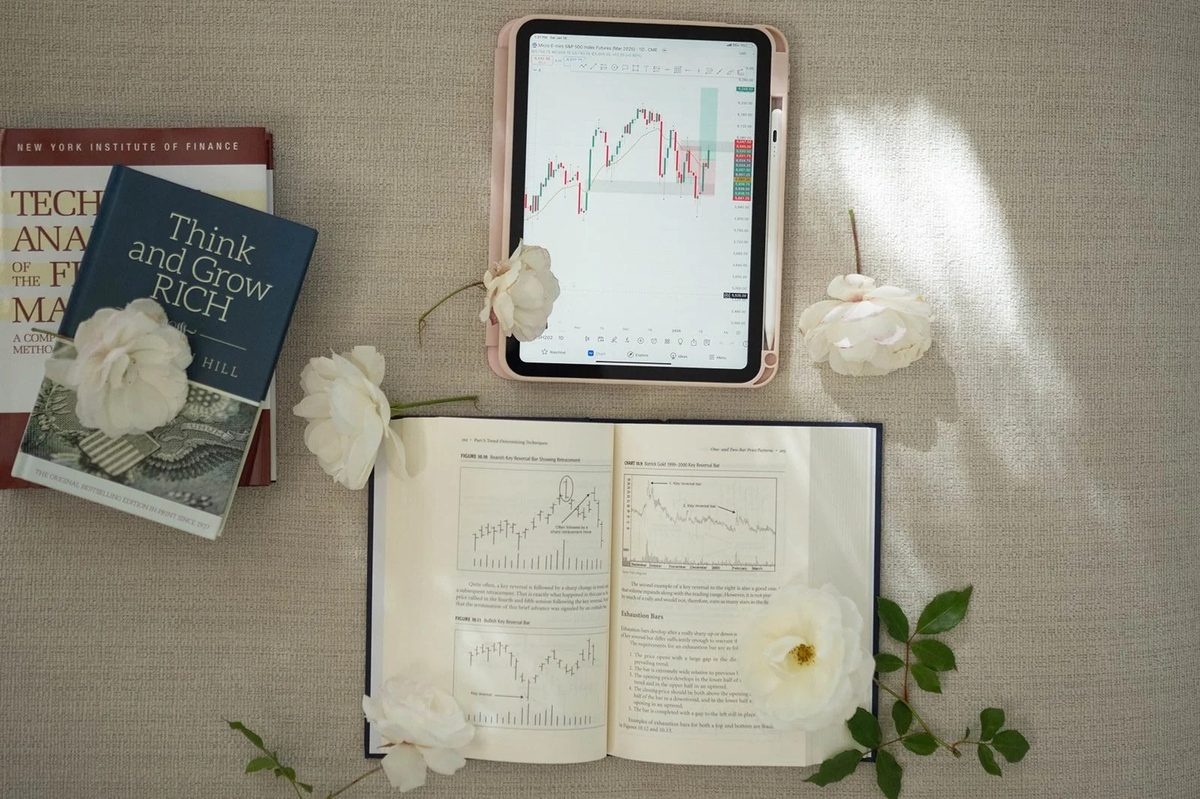
First, get on TradingView. It's free (with a basic account), and it's what professional traders use. Open a chart of EUR/USD on the 4-hour timeframe to start. You'll see candles — those are price movements over four hours.
Now add a 21EMA (exponential moving average). If you don't have our proprietary indicator, you can add this manually through TradingView's indicator library. Just search for "exponential moving average," set the period to 21, and add it to your chart.
Watch how price interacts with that line. Does it bounce off it? Does price stay above it for a while? These are the questions we ask every single day in our beginner classes.
Here's what the 21EMA does: it filters out the noise. Price moves around all the time — sometimes up, sometimes down, sometimes sideways. The 21EMA shows you the true trend. If price is above the 21EMA and moving up, that's a buy signal. If price is below it and moving down, that's a sell signal.
"I've watched these starter videos a million times. Then I attended the conference and everything clicked."
That's the foundation. Everything else builds on this. Don't overthink it. Successful traders don't have complicated systems. They have simple systems they execute with discipline.
For your broker, research different options in your country. We have members from all over the world, so we don't recommend one specific broker. I personally use Forex.com for forex trading and TradeStation for futures, but that's my choice. You need to do your own research and choose what works for you and what's available where you live.
When you're choosing a broker, look for these things: Can you trade the pairs you want? What are the spreads (that's the cost to trade)? Can you trade on demo first? Is it regulated? Don't open a live account until you've spent at least two weeks on demo.
The Best Way to Learn Forex Trading Step by Step
This is where most beginners fail. They know what the 21EMA is. They know what a candle is. But they don't know how to recognize a trading opportunity. So let me break down our exact process.
Step one: Check the daily and weekly charts first. This is what professional traders call "zooming out." Don't jump straight to the 15-minute chart. Look at the big picture first. Is the overall trend up or down? Where is price in relation to major moving averages?
Step two: Once you know the big picture, zoom into the 4-hour or 1-hour chart. Look for price touching the 21EMA. This is our sweet spot for entries. We call it an "A+ entry."
Step three: Set your stop loss. This is the most important part. If price moves against you past a certain point, your trade exits automatically. We use the concept of "risk-to-reward." Maybe you're willing to risk $100 to make $200. That's a 1:2 risk-to-reward.
Step four: Wait for price to move. Don't sit and stare at the chart all day. Set your trade and walk away. This is hard for beginners because we want to be "in the action." But the professionals know: active trading isn't profitable. Disciplined, systematic trading is.
"Unless you're genuinely ready and willing to receive this information, nothing's ever gonna change. If today you're ready to come with an open mind and an open heart, you're ready to receive some truths and you're ready for change — that's when this works."
Here's the thing about demo trading: it teaches you the mechanics, but it doesn't teach you discipline. On demo, you don't feel the emotional weight of losing money. So when you finally go live, suddenly you're making stupid decisions because you're scared.
This is why we spend time in our beginner classes talking about mindset as much as we talk about charts. Your psychology is 80% of trading success. Your strategy is only 20%.
"I passed two more combines in 2 days and I met my daily goal for my first funded account this morning!"
When you're ready to move from demo to live trading, start small. Really small. Maybe $500 or $1,000. Not because you're going to get rich on that amount, but because you need to feel what it's like to have real money at risk. Only after you've proven yourself on a small account should you fund a larger one.
The progression we recommend is simple: demo for at least two to four weeks, then a small live account for another four weeks. If you're profitable and consistent in both phases, you're ready to scale up. If not, you're not. No shortcuts.
What we teach: Stay in demo, hang out in demo as long as you need to, as long as you want to, until you really understand the power of the system and why we trade it. There's no shame in staying on demo for months. The shame is in blowing up a real account.
I've been trading for over six years, and I still use demo. I'll test a new idea on demo before I ever use real money. Every single professional trader does this. Demo isn't for beginners only — it's for everyone who respects the market.
One thing I want to be clear about: there's no secret. There's no indicator that predicts the future. There's no broker that guarantees profits. What matters is that you have a system, you execute it with discipline, and you manage your risk. That's what we teach at TFW Global.
When you join us, you're not getting some fancy algorithm. You're getting simplicity. You're getting a community of women who understand that trading is hard, but not impossible. You're getting access to live trading sessions where you can watch our process in real time. And most importantly, you're getting weekly classes where you can ask questions and learn from people who are actually making money in the markets.
The women who succeed in our community aren't the ones who jump straight to prop firms or try to day trade with five figures on day one. They're the ones who play the long game. They learn on demo. They start small. They build consistency. They let the compounding effect work over months and years.
"Every single trade that you take needs to be like a business plan. You don't go and launch a business before you have your plan. The same is true with trading."
If you're ready to start this journey, here's what I want you to do right now: Open TradingView, set up a demo account with a broker, add a 21EMA to a chart, and just watch. Watch how price interacts with that moving average. Watch for three or four days before you even place a single trade.
In our beginner classes, we walk through this step by step. We sit with you in the confusion. We answer questions. We celebrate the small wins. Because that's what trading is — small, consistent wins over a long period of time.
You're not going to turn $1,000 into $100,000 overnight. But you can consistently make 1% per week on a small account and let it compound into something significant over time. That's the real path to financial independence through trading.
Related reading: forex indicators for beginners, how to start forex trading, and demo vs live trading.